Battery Life Claims: Why Yours Never Matches the Box
Quoted battery figures come from specific test conditions. How mAh, Wh and "up to" hours are measured, and how to estimate real-world runtime.
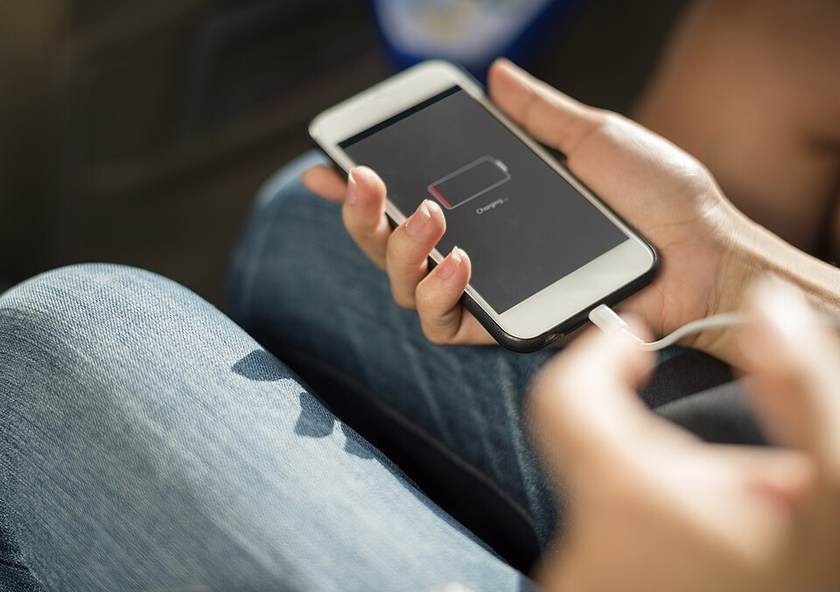
Battery claims are not usually false. They are answers to a question you did not ask, produced under conditions you will never reproduce, and presented in a unit that often cannot be compared with the next product along the shelf.
This guide explains what each figure measures, what the test behind it assumed, and how to turn a headline number into something closer to what you will experience.
mAh, Wh and why only one lets you compare
Milliampere-hours measure charge — how much current a cell can supply for how long. They say nothing about energy on their own, because energy also depends on voltage. Two batteries quoted at the same mAh but operating at different voltages hold different amounts of energy.
Watt-hours resolve this: multiply mAh by the nominal voltage and divide by 1,000. A cell rated 4,000 mAh at 3.7 V holds about 14.8 Wh. Because manufacturers within a category usually use similar cell voltages, mAh comparisons happen to work within phones or within power banks — and break the moment you compare across categories, which is why watt-hours is the honest unit and why it is what airlines use.
Power banks add a second trap: capacity is rated at internal cell voltage but delivered at a higher output voltage through a converter, and the conversion loses energy as heat. The mechanics are set out in product specifications explained; the practical consequence is that a headline mAh figure and the charge your phone receives are two different numbers.
The test conditions behind an "up to" figure
Hours are the figure buyers actually care about, and the one most dependent on undisclosed assumptions. A quoted runtime describes a specific scripted activity, at a specific screen brightness or volume, with specific radios enabled, on a new battery, at a comfortable temperature.
Change any of those and the figure moves. Typical assumptions that flatter a headline: a single task rather than several; moderate rather than high brightness; a stable network connection rather than a weak one; noise cancelling off, or on, whichever produces the better number; and no background synchronisation. For headphones, the same figure is often quoted with and without active noise cancelling in different places on the same page — the pattern noted in headphone specifications explained.
The words to look for are "up to", which signals a best case, and any footnote describing the test. A manufacturer publishing its test conditions is being straight with you; one publishing only a number has told you less than it appears.
What drains a battery in real use
Power goes to a small number of places, in a fairly predictable order.
The display is usually the largest single consumer on any device with a screen, and consumption rises steeply with brightness. Refresh rate and panel type matter too, which is the subject of screen specifications explained.
Radios — cellular, Wi-Fi, Bluetooth, location. A weak signal is far more expensive than a strong one, because the transmitter works harder to maintain the link. A device at the edge of coverage can drain remarkably fast while apparently doing nothing.
Sustained processing — video, games, navigation, exports. These also generate heat, which reduces efficiency further.
Background activity — synchronisation, notifications, location checks. Individually small, collectively continuous, and entirely absent from most test scripts.
Charging speed claims and the percentage trick
Charging is not linear. Lithium-ion cells accept a high rate while relatively empty, then charging deliberately slows as the cell fills, to protect it. That is why fast-charge claims are quoted to a partial state — a figure to 50 or 80 per cent describes the fastest section of the curve, and cannot be doubled to estimate a full charge.
Three further conditions usually apply and are rarely prominent: the supplied charger and cable, or a specific standard; a device not in heavy use during charging; and a moderate ambient temperature, since charging slows when hot or cold.
Watch also for a wattage figure quoted for the charger rather than what the device accepts. A high-output charger does not make a device charge faster than it is designed to, and pairing the two figures is a common source of disappointment.
Battery health, cycles and degradation over years
Every rechargeable cell loses capacity as it ages, through cycling and through simple calendar time. Manufacturers describe this as retaining a stated proportion of original capacity after a stated number of full charge cycles; the specific figures are published per device and vary, so check the manufacturer's own documentation rather than a rule of thumb.
Two things follow for buyers. Degradation is normal function, not a fault, which is why batteries are excluded from most guarantees as wear parts. And because the battery is usually what ends a device's comfortable life, the replaceability question matters more than the headline runtime — a device with an affordable, published battery replacement has a longer useful life than an identical one without, which is the argument in how to choose future-proof tech.
Where a device reports battery health, treat it as the most useful specification it publishes, because it is measured on your unit rather than in a laboratory.
Cold weather, brightness and background load
Temperature. Cold increases internal resistance and reduces the capacity a cell can deliver, so runtime falls in winter and a device may shut down with charge apparently remaining. Most of this is temporary and returns as the battery warms. Sustained heat is the more damaging condition, accelerating permanent degradation — which is why leaving a device in direct sun or charging it under a pillow is worse than using it in the cold.
Brightness. The single most effective user-side lever on any screen device, and the variable test scripts set most conservatively.
Background load. The gap between a freshly configured device and one carrying years of accumulated applications is real, continuous, and invisible in any published figure.
Estimating realistic runtime from a quoted figure
- Find the test conditions. If they are published, compare them with how you will actually use the device. If they are not, treat the number as a ceiling.
- Identify your dominant load — screen, radios, processing, cancellation — and check whether the quoted test exercised it. A figure from an audio playback test tells you little about video.
- Apply a discount for mixed use, and a further one for a device you will keep for years, since the battery you buy is the best it will ever be.
- Prefer independent measurements with a stated method over any manufacturer figure, for the same reason set out in product specifications explained.
- Check the replacement path — published price, service route, whether the pack is glued or fastened — because that determines how long the device stays usable, in the same way construction does in how to judge product quality online.
Frequently asked questions
Is a higher mAh always a bigger battery?
Only at the same voltage. mAh measures charge, not energy, so it compares validly only between cells operating at the same voltage. Watt-hours — mAh × voltage ÷ 1,000 — compares across devices.
Why do I never reach the quoted battery life?
The figure comes from a defined test: one task, moderate brightness, limited background activity, a fresh battery, a comfortable temperature. Real use involves several tasks, higher brightness, network activity and an ageing cell.
What does a fast-charging claim measure?
Usually a partial charge under ideal conditions. Charging slows deliberately as the cell fills, so a figure quoted to 50 or 80 per cent covers the fastest part of the curve and cannot be doubled.
Does cold weather reduce battery life?
Yes — low temperatures raise internal resistance and reduce deliverable capacity, so runtime falls and a device may shut down with charge apparently left. Most of that is temporary; sustained heat causes the permanent damage.
How we write this guide
This article is research-led. It draws on established lithium-ion cell behaviour — the relationship between charge, voltage and energy, the tapering charge curve, temperature effects on internal resistance and deliverable capacity, and capacity loss through cycling and calendar ageing — together with the way manufacturers conventionally publish runtime and charging figures and the test conditions those figures depend on.
We have measured no devices, and this guide gives no runtimes, capacities, retention percentages or charging times: those are published per product by manufacturers and vary widely, and an invented figure would be repeated as though it were a benchmark. No products are named or ranked here.
Recommended Today may earn commission from links to retailers. Commission does not influence our editorial content or the order of any recommendation. Tech & Audio guides are reviewed every 6 months. Next scheduled review: February 2027.